CIMCO Software Suite
MDC-Max
Manufacturing Data Collection and Monitoring
Collect data from your shop floor in real-time to discover and eliminate production bottlenecks, optimise resource utilisation and streamline processes.
The complete MDC solution
MDC-Max enables you to collect and analyse data from machines and operators to get real-time and historic insights into your shop floor's productivity, performance and quality.
MDC-Max lets you use the data in various ways and on different platforms. You can show the data on information screens throughout the shop floor and offices to keep everyone updated and motivated - or send the data to external systems, such as ERP or MES, for further analysis and integration.
Benefits
Improved efficiency
Understand the performance of equipment and personnel with real-time data collection. Eliminate production bottlenecks and optimise resource utilisation.
Accurate data collection
Eliminate manual, time consuming and often inaccurate data collection by automating and streamlining the entire data collection process.
Faster response times
Monitor and visualise the performance of equipment and personnel to respond faster, catch errors sooner, and communicate better.
Eliminate guesswork
Understand the inner workings of your production with customised reports including machine downtime, OEE and other essential KPIs.
Reduce administration time
Reduce paper reliance and administrative time. Update your ERP, MES or other administrative system with real-time data from equipment and personnel.
Access your data anywhere
Access data from one or more sites directly from your mobile device. Easily check the status of equipment or any other information critical to your operation.
Features
Real-time monitoring / Andon
See the current status and performance data of your machines on Andon boards, PC and mobile. Customise the layout and content of screens to suit your needs.
Customisable reports
Supports both standard and specialised network protocols to communicate with most manufacturing equipment. Mazak, Deckel, Agie, Fagor, Brother, Modbus, and many more.
Real-time reporting
Generate real-time reports that dynamically update as data comes in, such as machine timelines.
Works with your equipment
Collect data automatically or manually using your existing wireless network, Ethernet, RS-232 or Parallel I/O. Use existing barcode readers and PCs on the shopfloor.
Integration with external systems
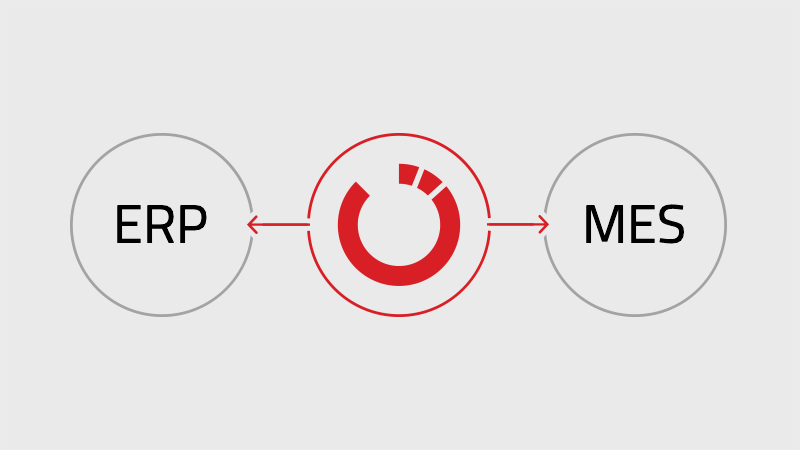
Streamline data management and workflows by updating ERP, MES or other administrative systems directly with data from MDC-Max.
Operator interface (manual collection)
Enables operators to access essential information directly at the machine and enter data such as current shift, job, reasons for downtime and scrap.
Andon and signaling units

Control signaling units such as stack lights, buzzers and Andon boards that indicate the status of your machines.
Email and text notifications

MDC-Max can send text and email alerts to key staff on any machine and operator event such as automatically during unattended runs.
Secure user management

Fine-grained control over user access and permissions. View logs of user actions and system events for auditing and troubleshooting purposes.
Data Collection
While data from machines can be collected automatically, error-free and unattended, the manual data from personnel provides the context to fully understand downtime, scrap and other factors affecting production negatively.
COLLECTION TYPES
Automatic data collection
Machine data is collected automatically and unattended through a network. When a machine event occurs, such as starting or stopping, the signals associated with those events are sent to MDC-Max, stored and processed for further use.
Manual data collection
Operator data provides the context needed to fully understand reasons for downtime, scrap or other negative factors. For manual data collection, MDC-Max provides an operator interface for PC and mobile devices. It also comes with full support for barcode readers.
INTERFACES
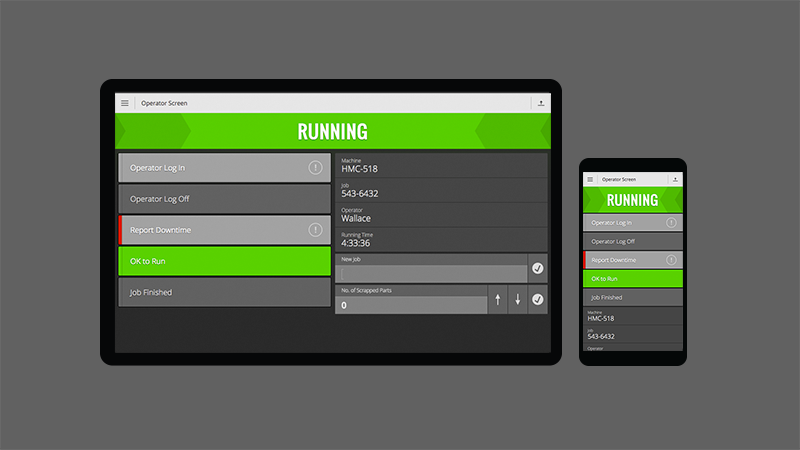
Operator Screen
Enables operators to access vital information and enter reasons for downtime, scrap, current job/operator/shift, and more. Can be customised and accessed with a mobile device or PC. One device can manage several machine-specific Operator Screens. Operator tablets can also be mounted at every machine.
Barcode readers
Enables operators to scan a barcode to provide reasons for downtime, scrap, current job/operator/shift, and more. MDC-Max can generate and print barcodes. Mostly relevant if barcode readers are already available. Otherwise, we recommend using Operator Screens.
INITIAL SETUP
Start small
More data does not always equal more value and an MDC system always requires new workflows and training. The best way to succeed, is to start small and get the easy benefits by analysing only three to five data points. With more experience, the system can be expanded. See examples below for inspiration.
1. Production vs. downtime
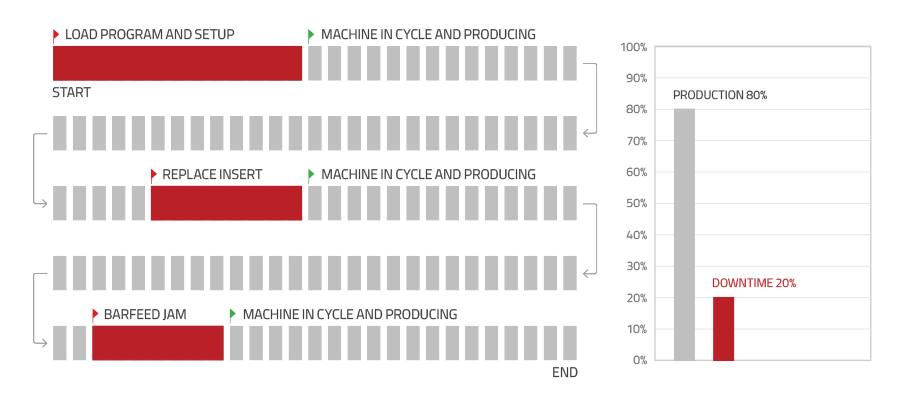
This solution gives data about the production or downtime of a machine. Data is collected automatically from the machine, so a supervisor needs to ask the operator the reason for the machine stoppage to get more information.
2. Downtimes in more detail
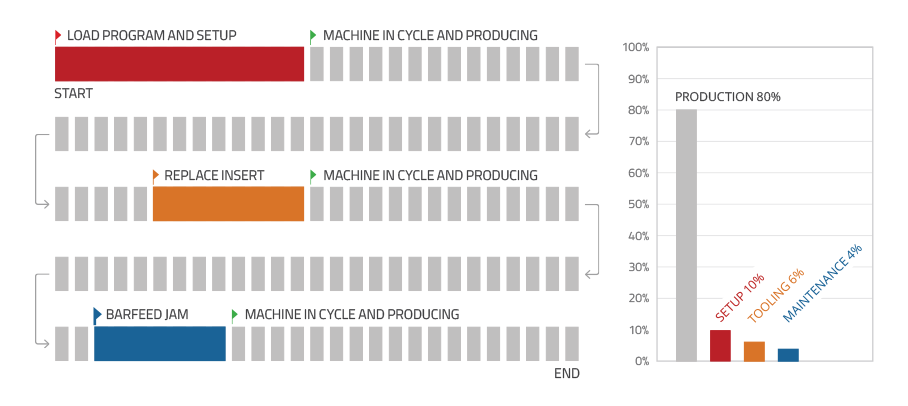
This solution accurately shows a machine's efficiency on every job. We can show the total downtime percentage for each type of stoppage such as Tooling, Setting, Maintenance, etc. The operator enters the reasons for downtime using an Operator Screen or a barcode reader which can then help identify the exact causes of production loss.
EXAMPLE
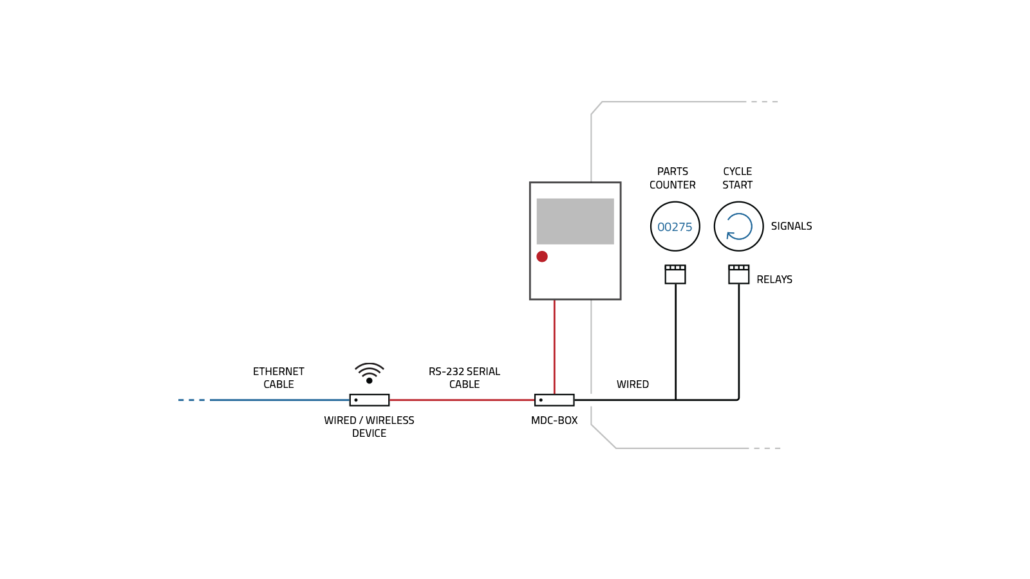
Elements in a setup
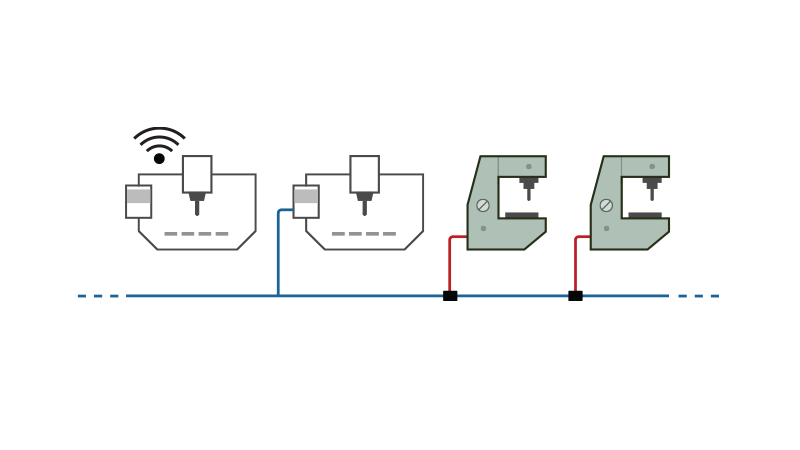
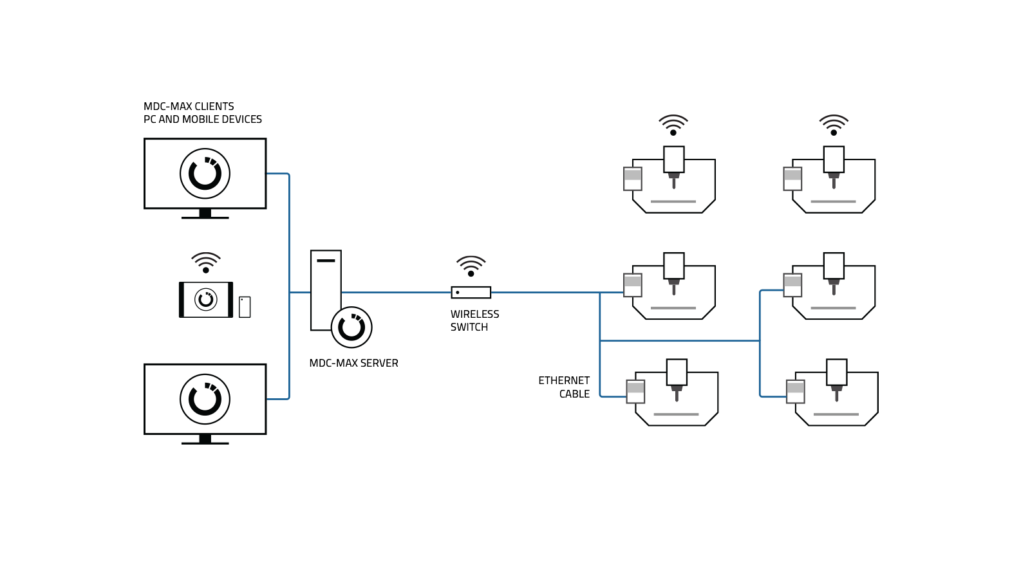
The following diagram shows a simplified MDC setup with data collection from machines and operators.
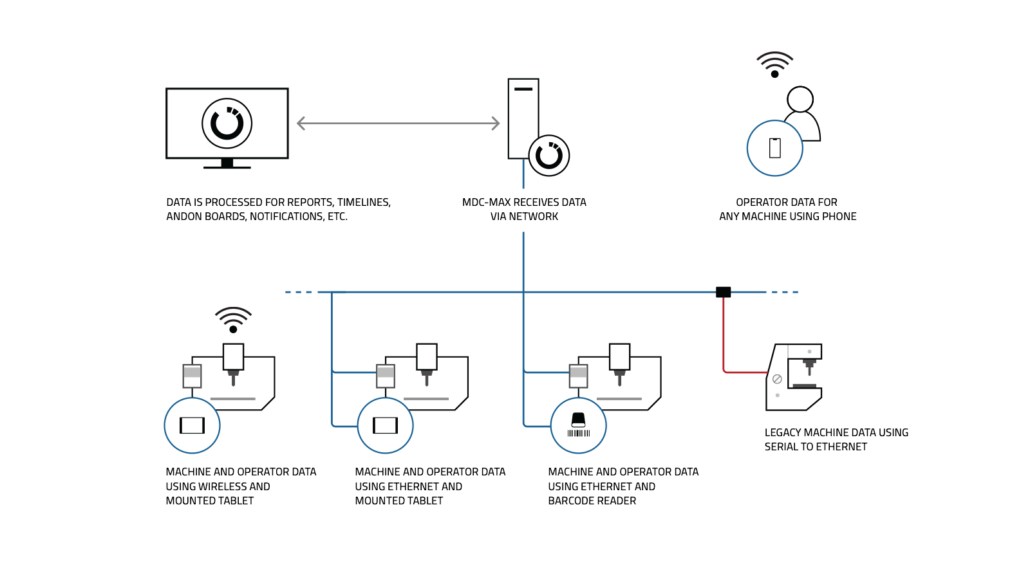
Machine signals and operator feedback are sent to MDC-Max through the local network using wireless and Ethernet.
Each machine has a tablet with the Operator Screen application or a barcode reader to provide data. An operator has a smartphone where he can provide data about any machine in the setup. He just opens the Operator Screen on his phone for the specific machine he is at.
A legacy machine has been connected with a serial connection to the Ethernet network (and some internal wiring) to track start and stop signals.
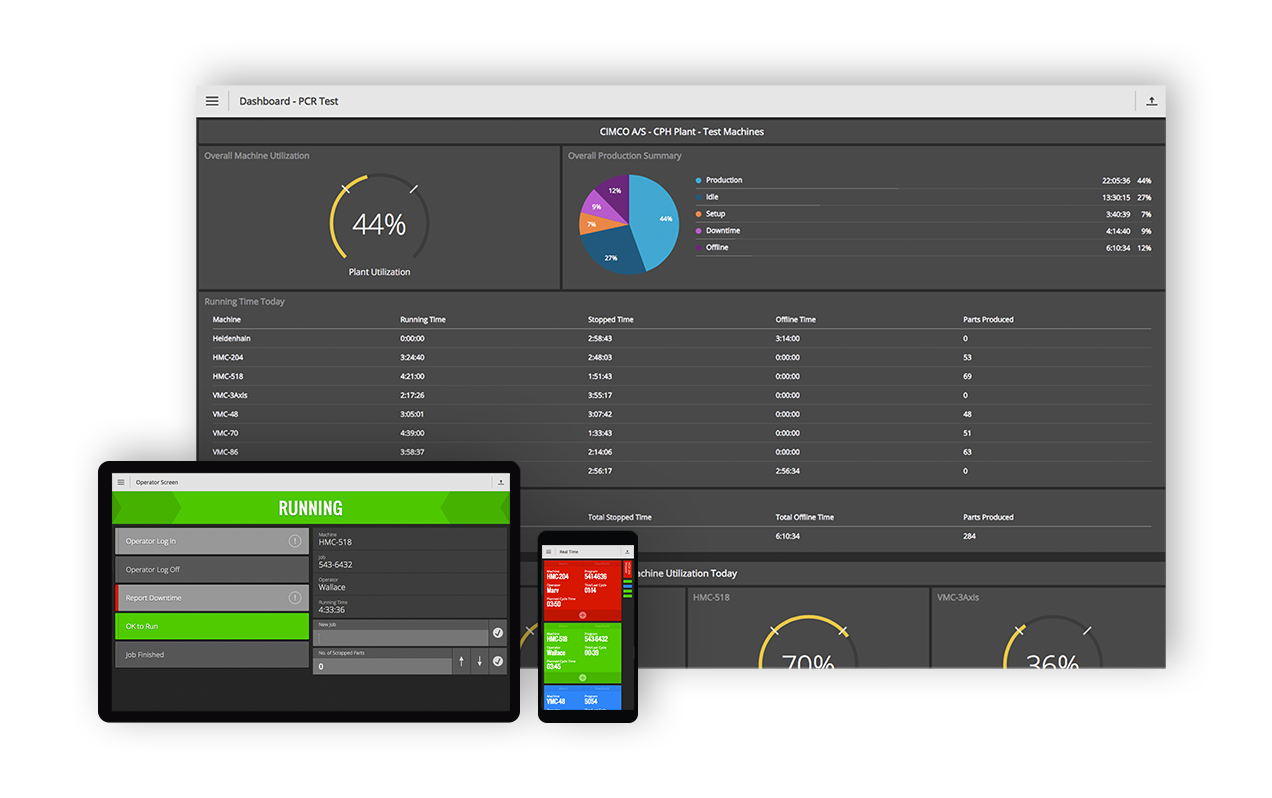
Real-time Monitoring / Andon
Machine and operator data can be visualised in real time on Andon boards and digital signage on the shop floor and office areas. Data can also be accessed remotely via any modern mobile device such as a smartphone or tablet.
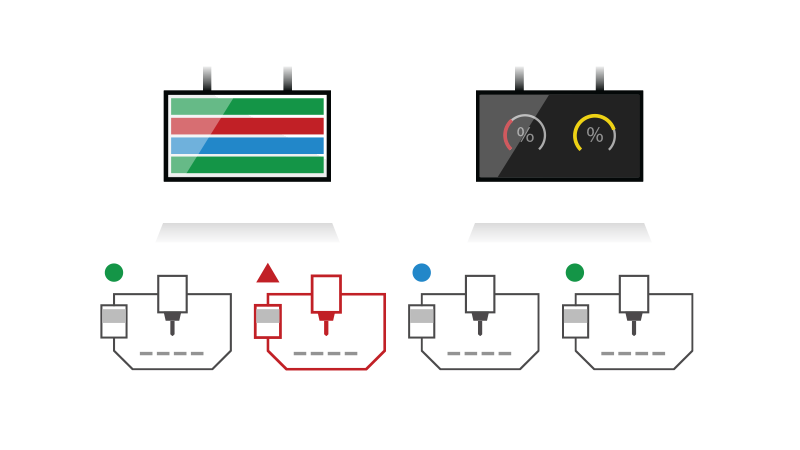
ANDON BOARDS
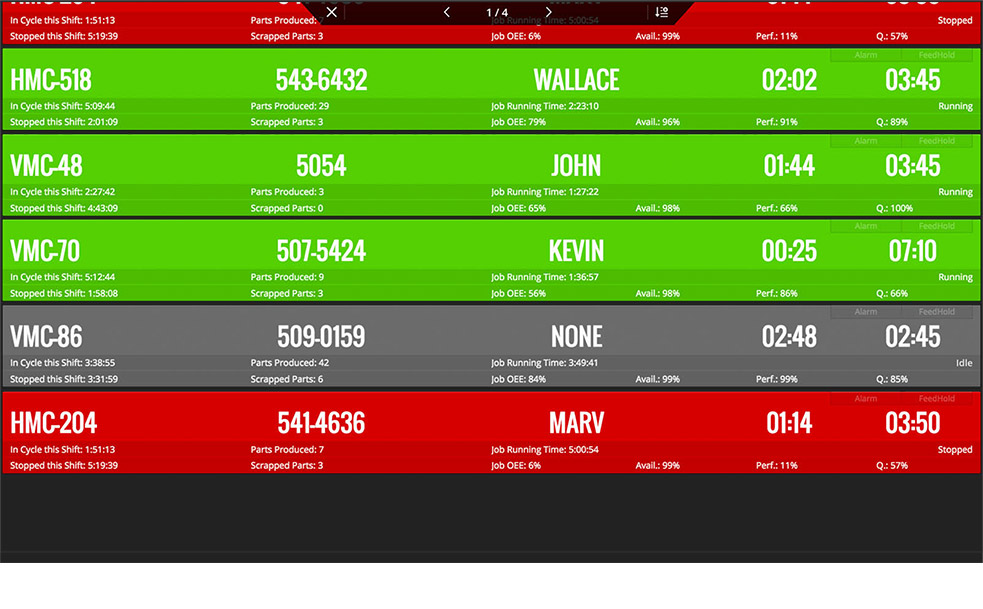
Live Screens
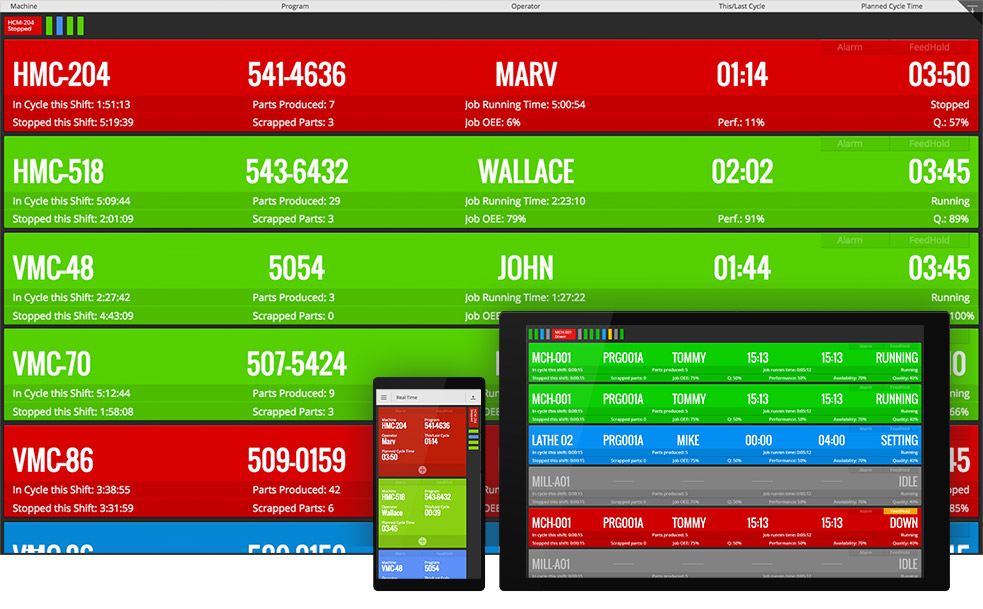
Machines are listed and colored to indicate state along with information such as cycle time, current job/operator/shift, parts, OEE, and more. Fully customisable and accessible on mobile, tablet, PC and smart TV.
Dashboards
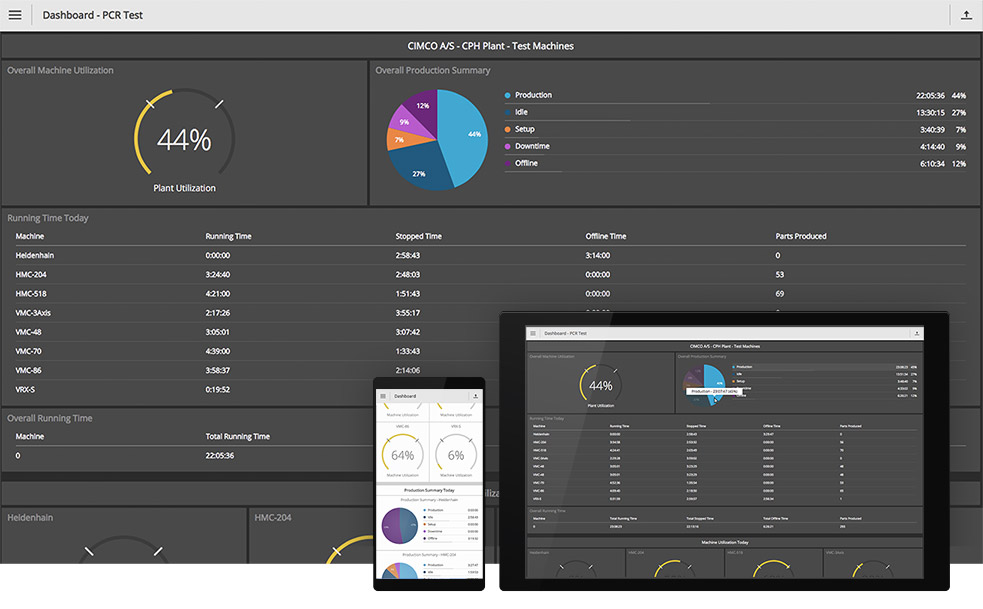
Dashboards are composed of data blocks such as Bar graph, Pie chart, Value list, Gauge, and more. Focus on different facilities, machine groups, and so on. Fully customisable and accessible on mobile, tablet, PC and smart TV.
Shop Floor Screens
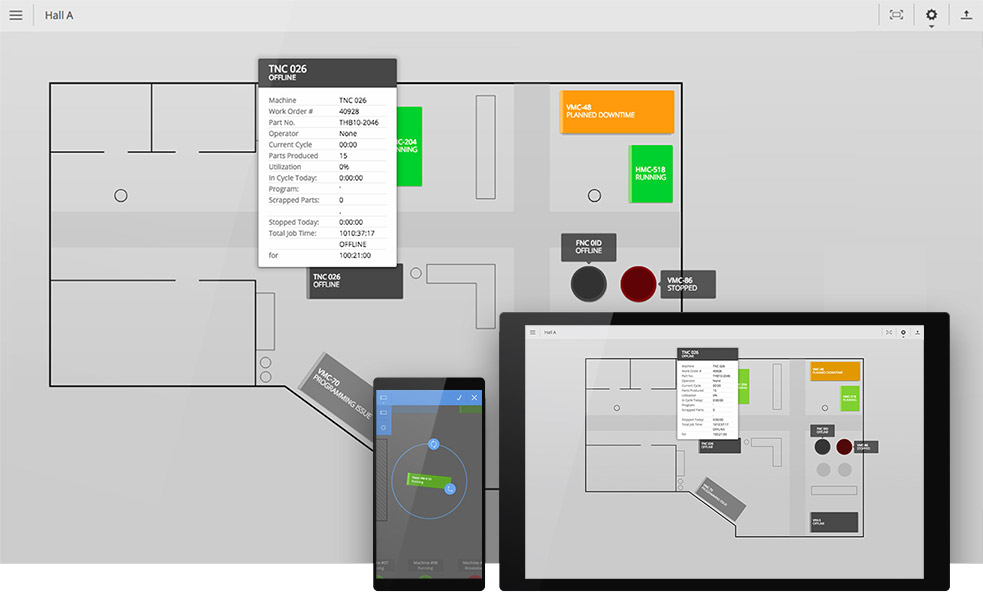
See the status of machines based on their location. Colors indicate state along with small alerts for additional status. Select a machine to view details. Fully customisable and accessible on mobile, tablet, PC and smart TV.
Slideshows
Combine Live Screens, Dashboards and Shop Floor Screens into Slideshows for information screens. Options include auto-scroll, pause and resume. Fully customisable and accessible on mobile, tablet, PC and smart TV.
ANDON UNITS
Stack lights, Buzzers, and more
Configure data events to control stack lights, beacons, buzzers, sound alarms and other Andon units for visual and audible feedback of machine state. A unit can be shared by a group of machines if needed.
UNATTENDED
Notifications and Lights-out monitoring
Notifications can be sent on any event. If machines are running unattended and one falls behind or stops, a stand-by operator can be notified promptly via text or email. Or a machine that is out of units to process and automatically notifies a nearby operator.
Reporting
Real-time and historic reports can be generated and viewed directly in MDC-Max or exported to Microsoft Excel. MDC-Max can also keep Excel sheets up-to-date or send data to external applications.
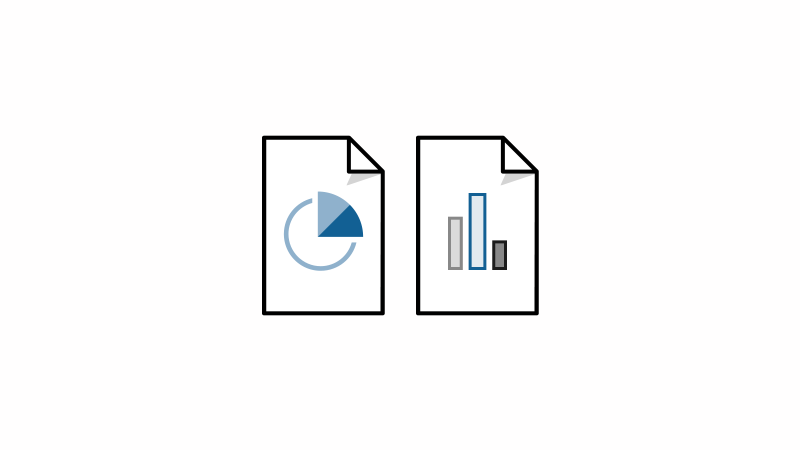
Reports
CUSTOM REPORTS
MDC-Max can generate custom real-time and historic reports from the data it collects. Data can be presented as tables, pie or bar charts, and production targets, work shifts, KPIs, and more can be included. You can also generate different Event logs such as by operator, machine, and job to check how each machine and operator is doing. Examples of other reports:
- Cycle time per part (min, max and average)
- Number of parts per shift/operator
- Number of scrapped parts
- Machine downtime
- Scheduled maintenance
- Unscheduled maintenance
- Setup time per part
- Operator effectiveness
- Overall Equipment Effectiveness (OEE)
- Mean time between failures (MTBF)
- Mean time to repair (MTTR)
EXAMPLES
Cycle time, duration and deviation
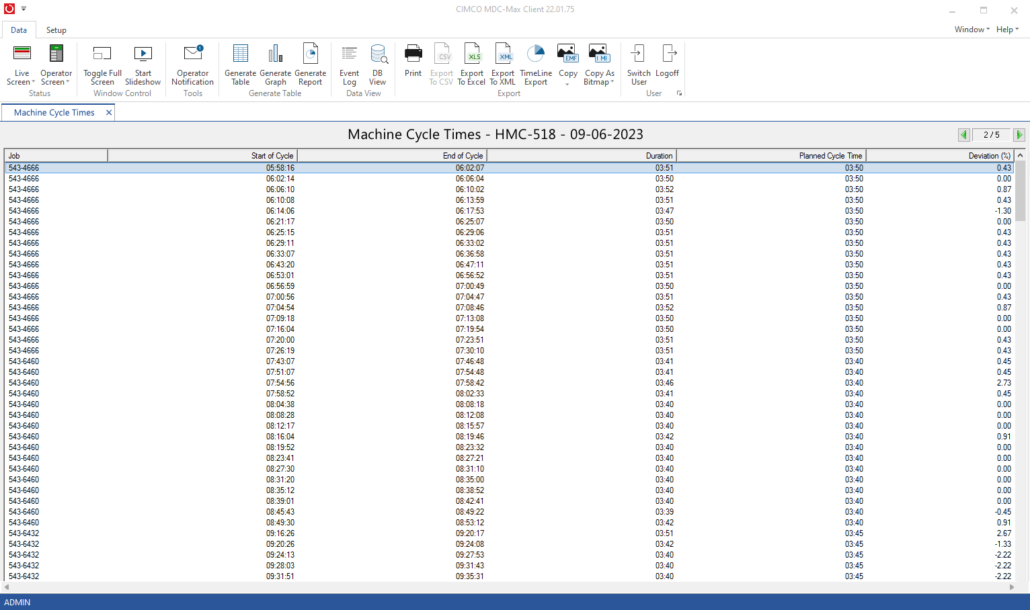
For each part in a job we can see the cycle start and stop times, duration and deviation (%) from the planned cycle time.
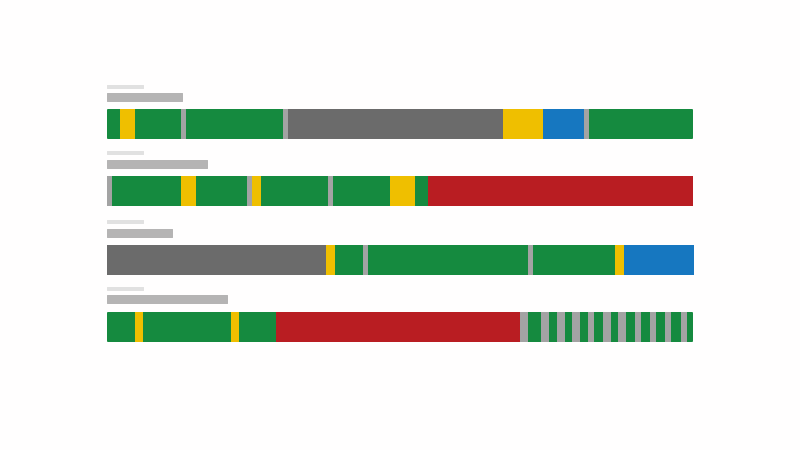
Machine utilisation as timeline
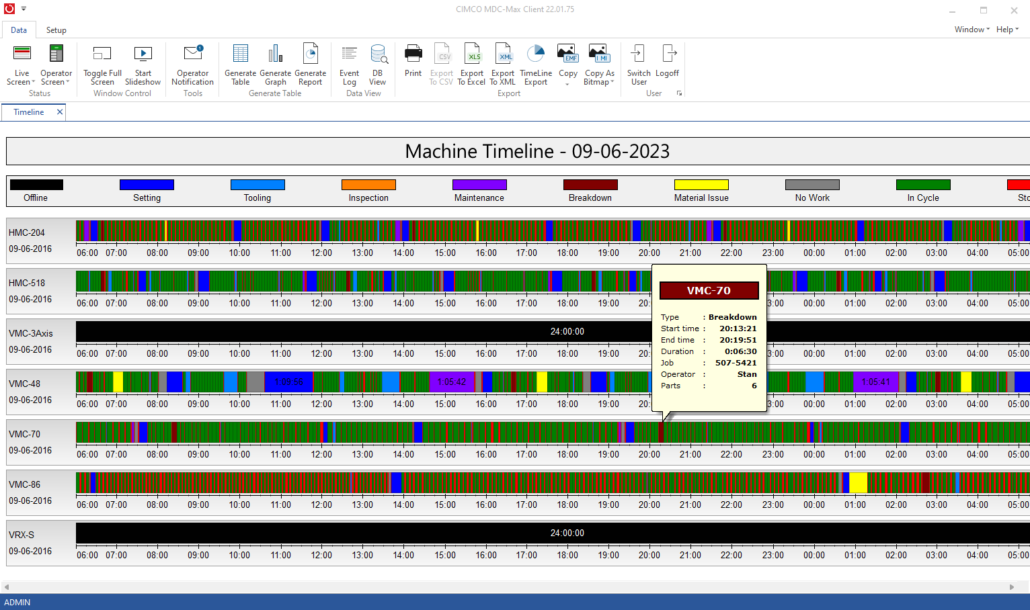
Each timeline shows the exact machine status during the selected time frame and dynamically update at a set interval to include new data.
Productivity summary chart
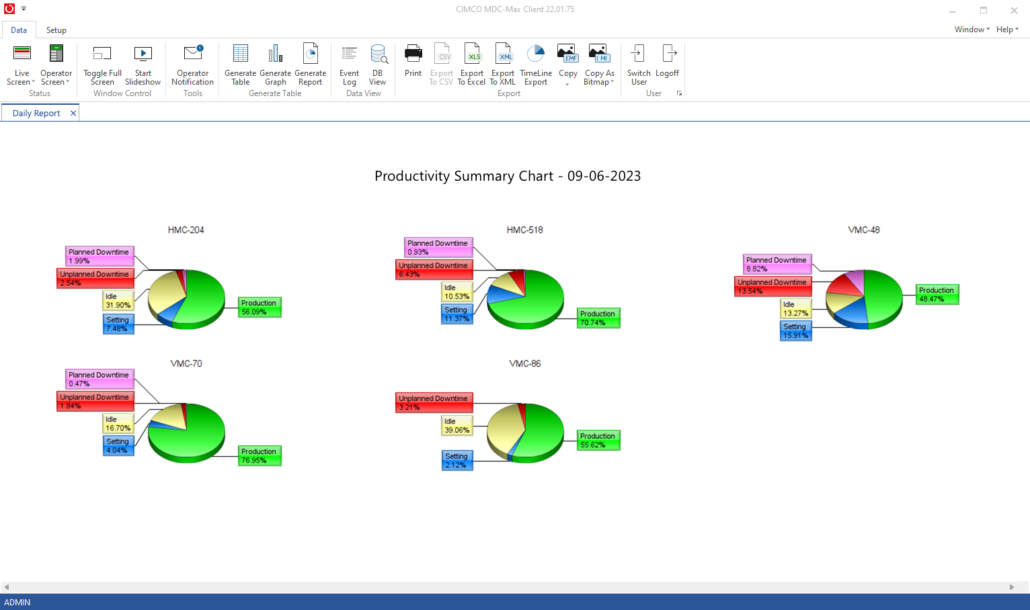
Summarised utilisation in percent and visualised as Pie charts. Makes it easy to see how each machine is doing.
Machine utilisation with target
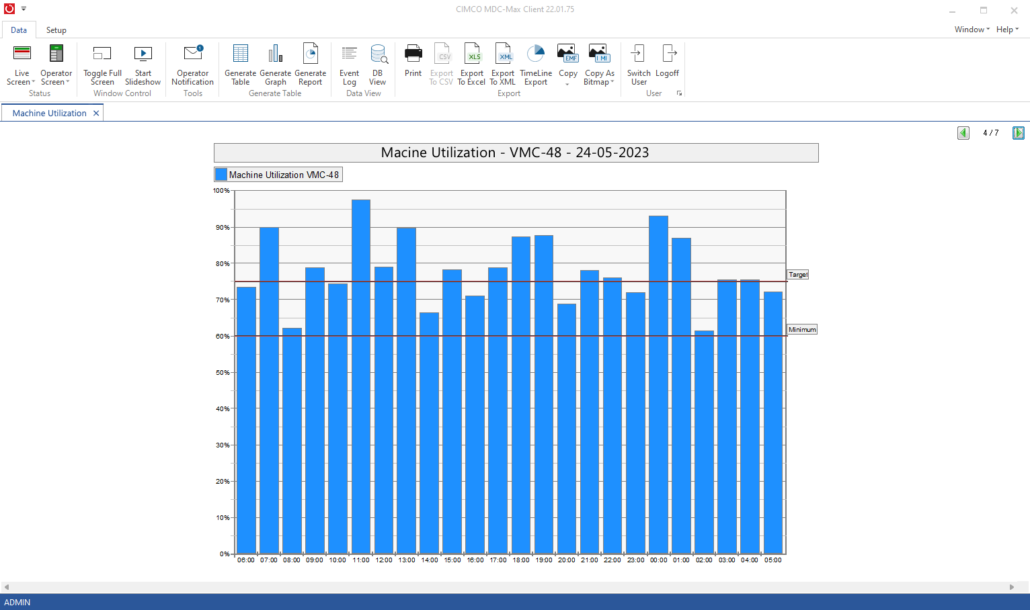
Bar chart showing machine utilisation in percent over a 24 hour time period. Target and Minimum values added.
Daily overview
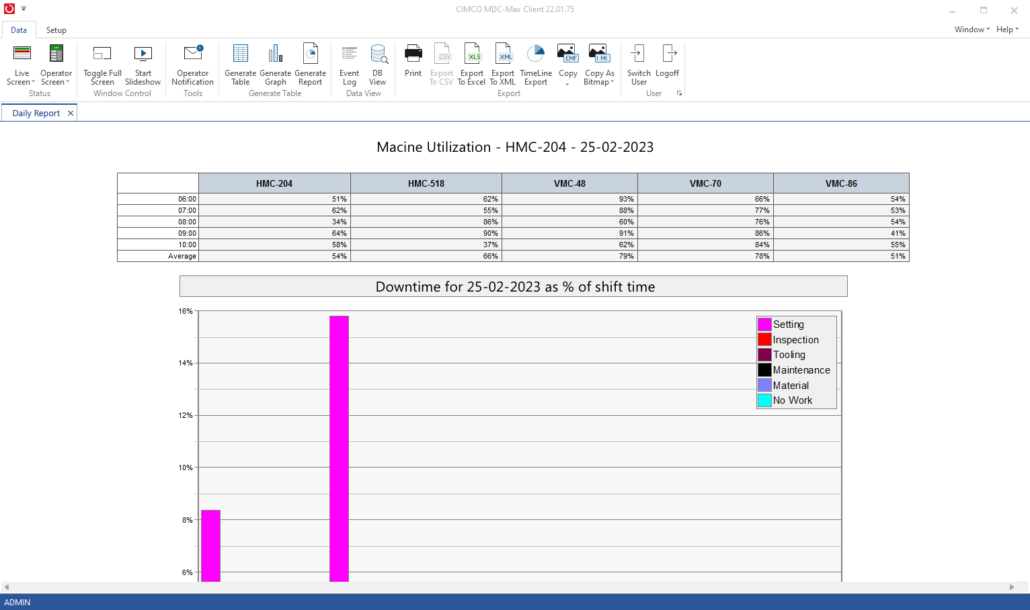
Overview of utilisation for several machines and downtime as a percentage of the total shift time.
Microsoft Excel
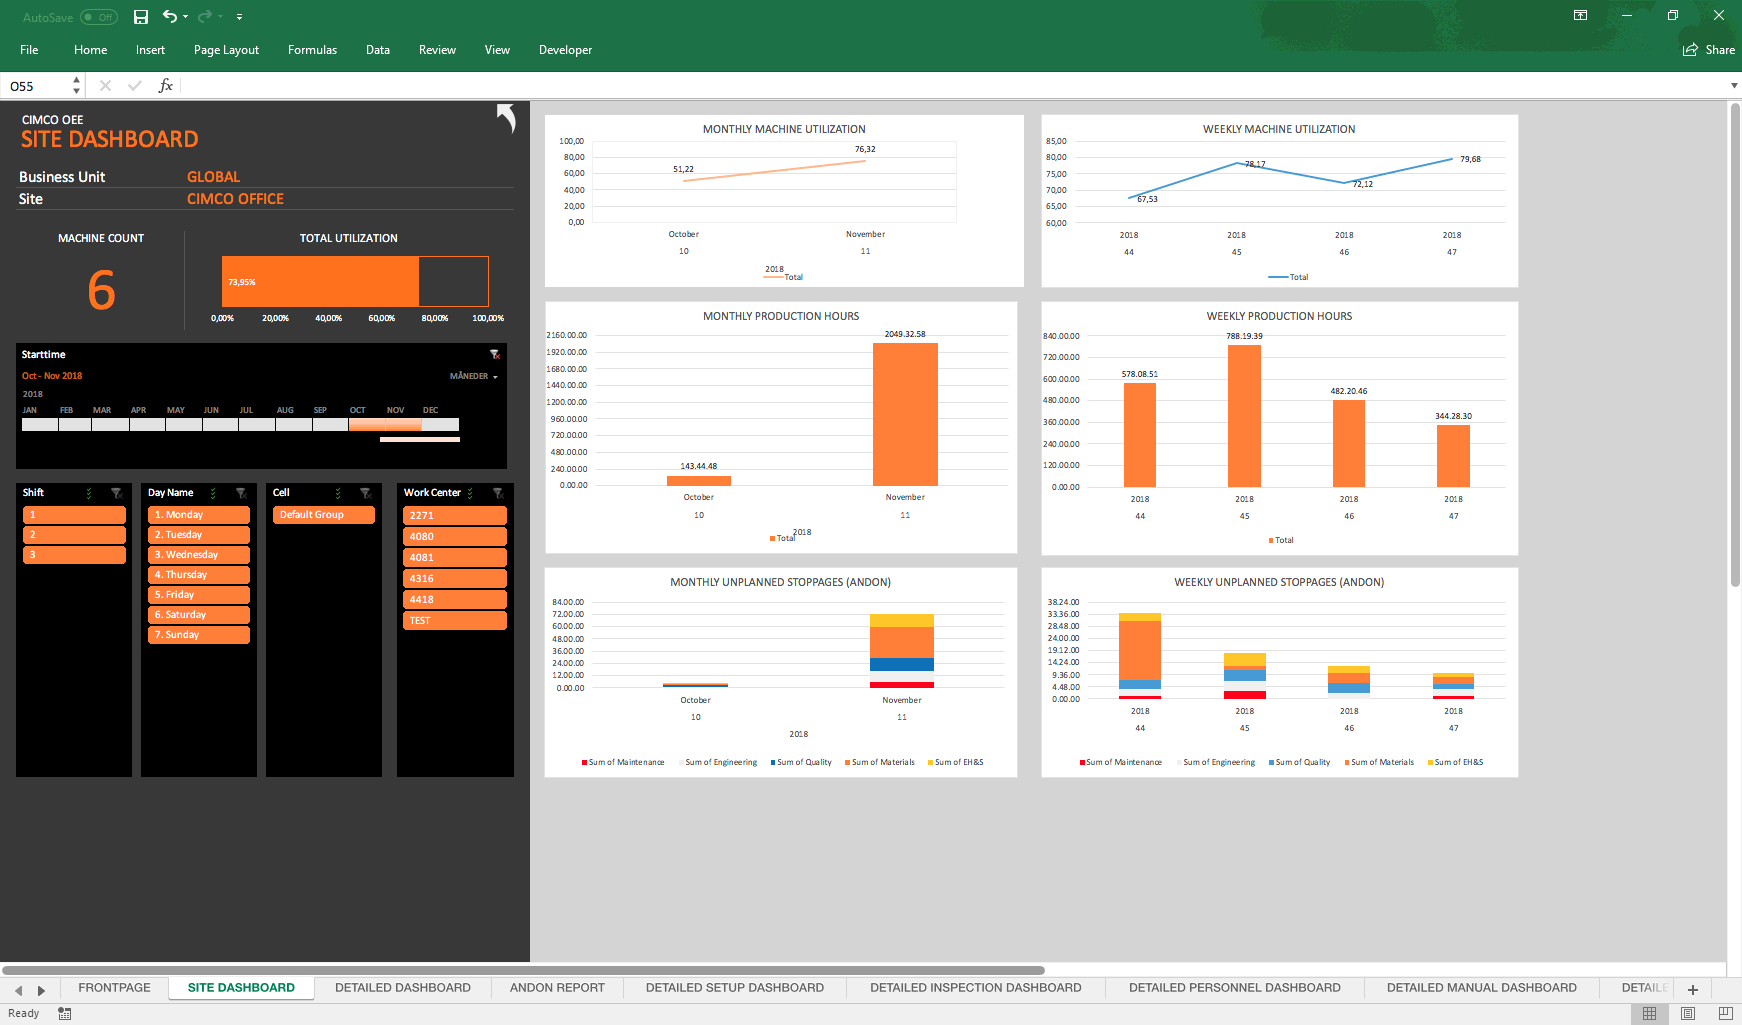
STAND-ALONE REPORTS IN EXCEL
Stand-alone reports provides a direct and convenient way for authorised users to access and update MDC-data in Excel reports without using MDC-Max. Reports can take advantage of all the built-in functionality that Excel has to offer such as Column-, Line-, Pie-, and Bar Charts. Once a report is configured, Excel provides the flexibility to filter data by machine(s), operator(s), time period, and more.
EXPORT REPORT DATA TO EXCEL
MDC-Max can also export the data of any configured report to Excel. This enables you to generate and view reports in MDC-Max and export the same data for further analysis in Excel.
Site Dashboard
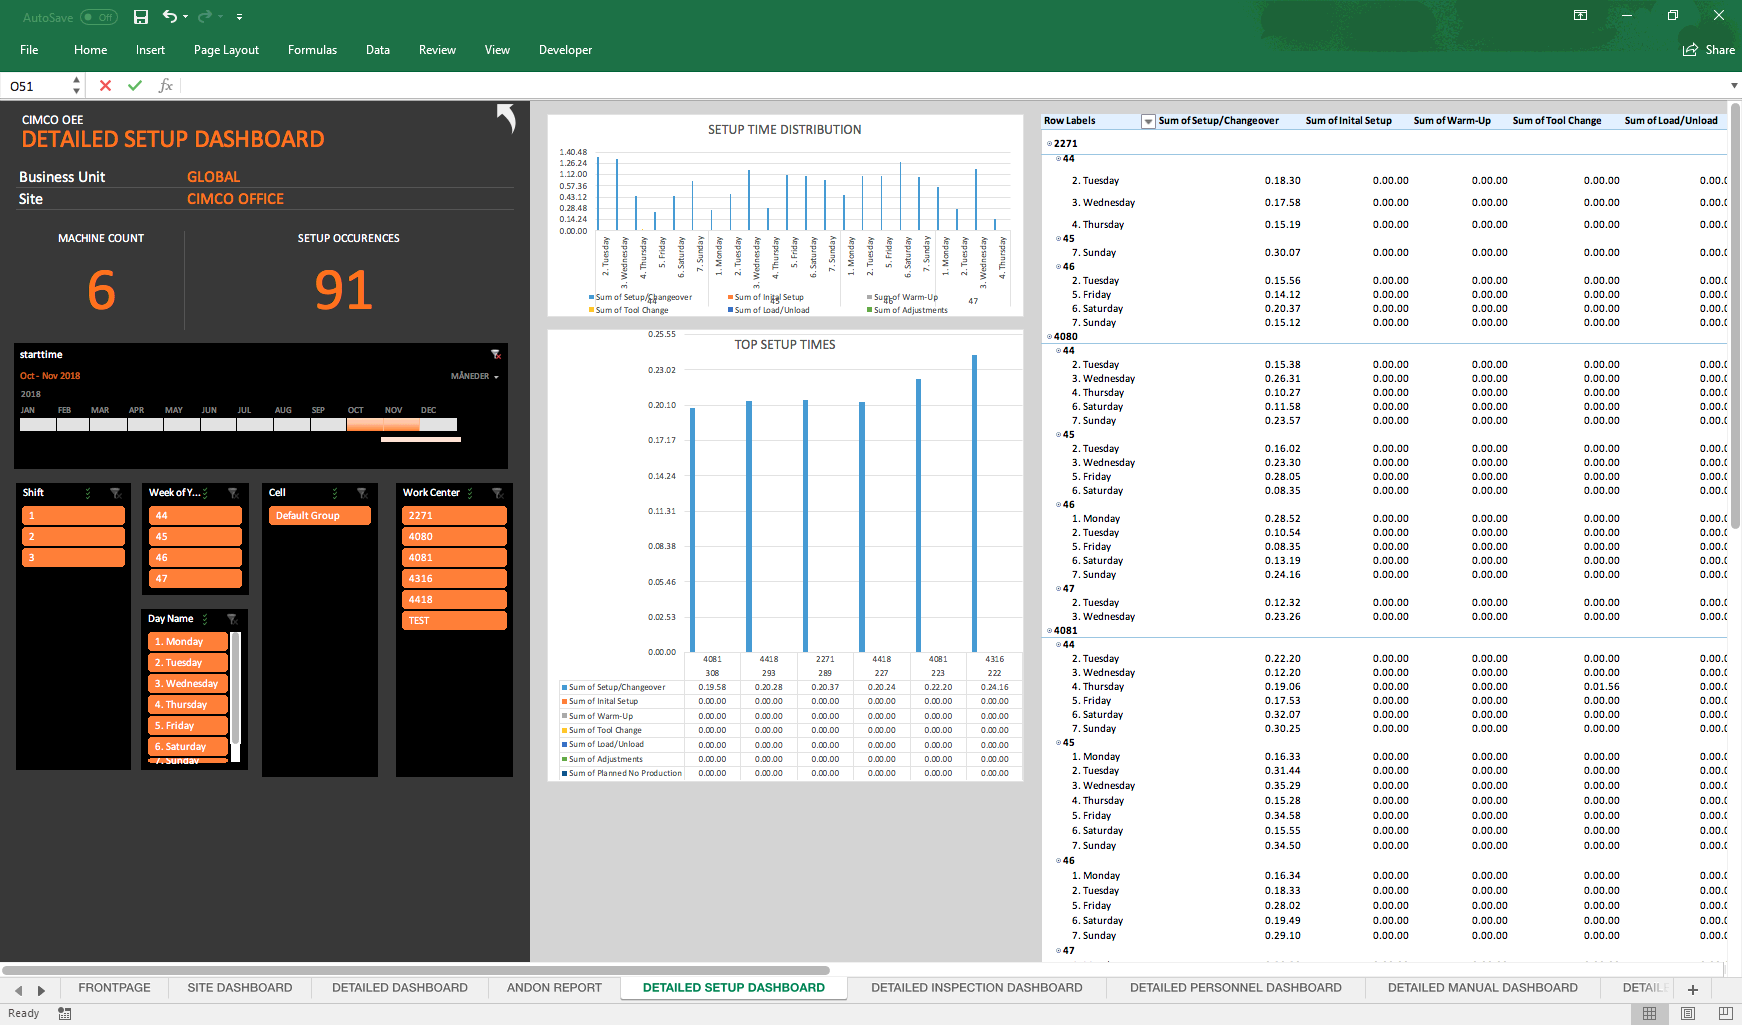
Detailed Setup Dashboard
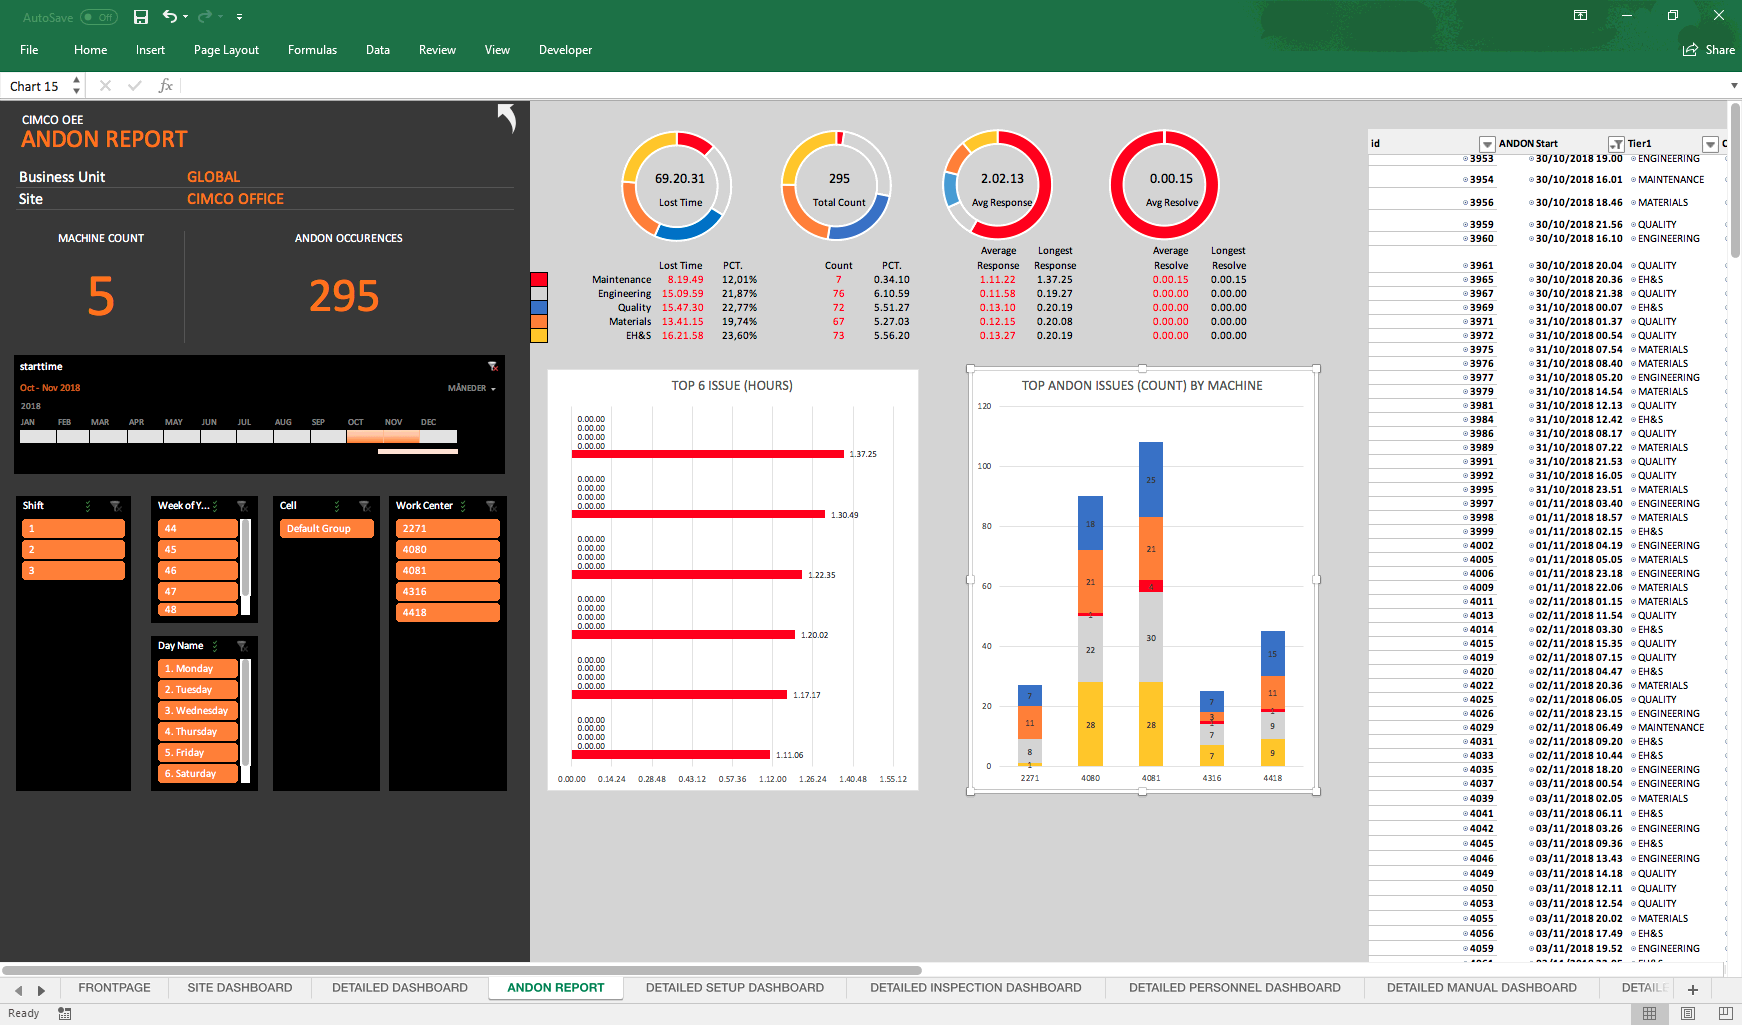
Andon Report
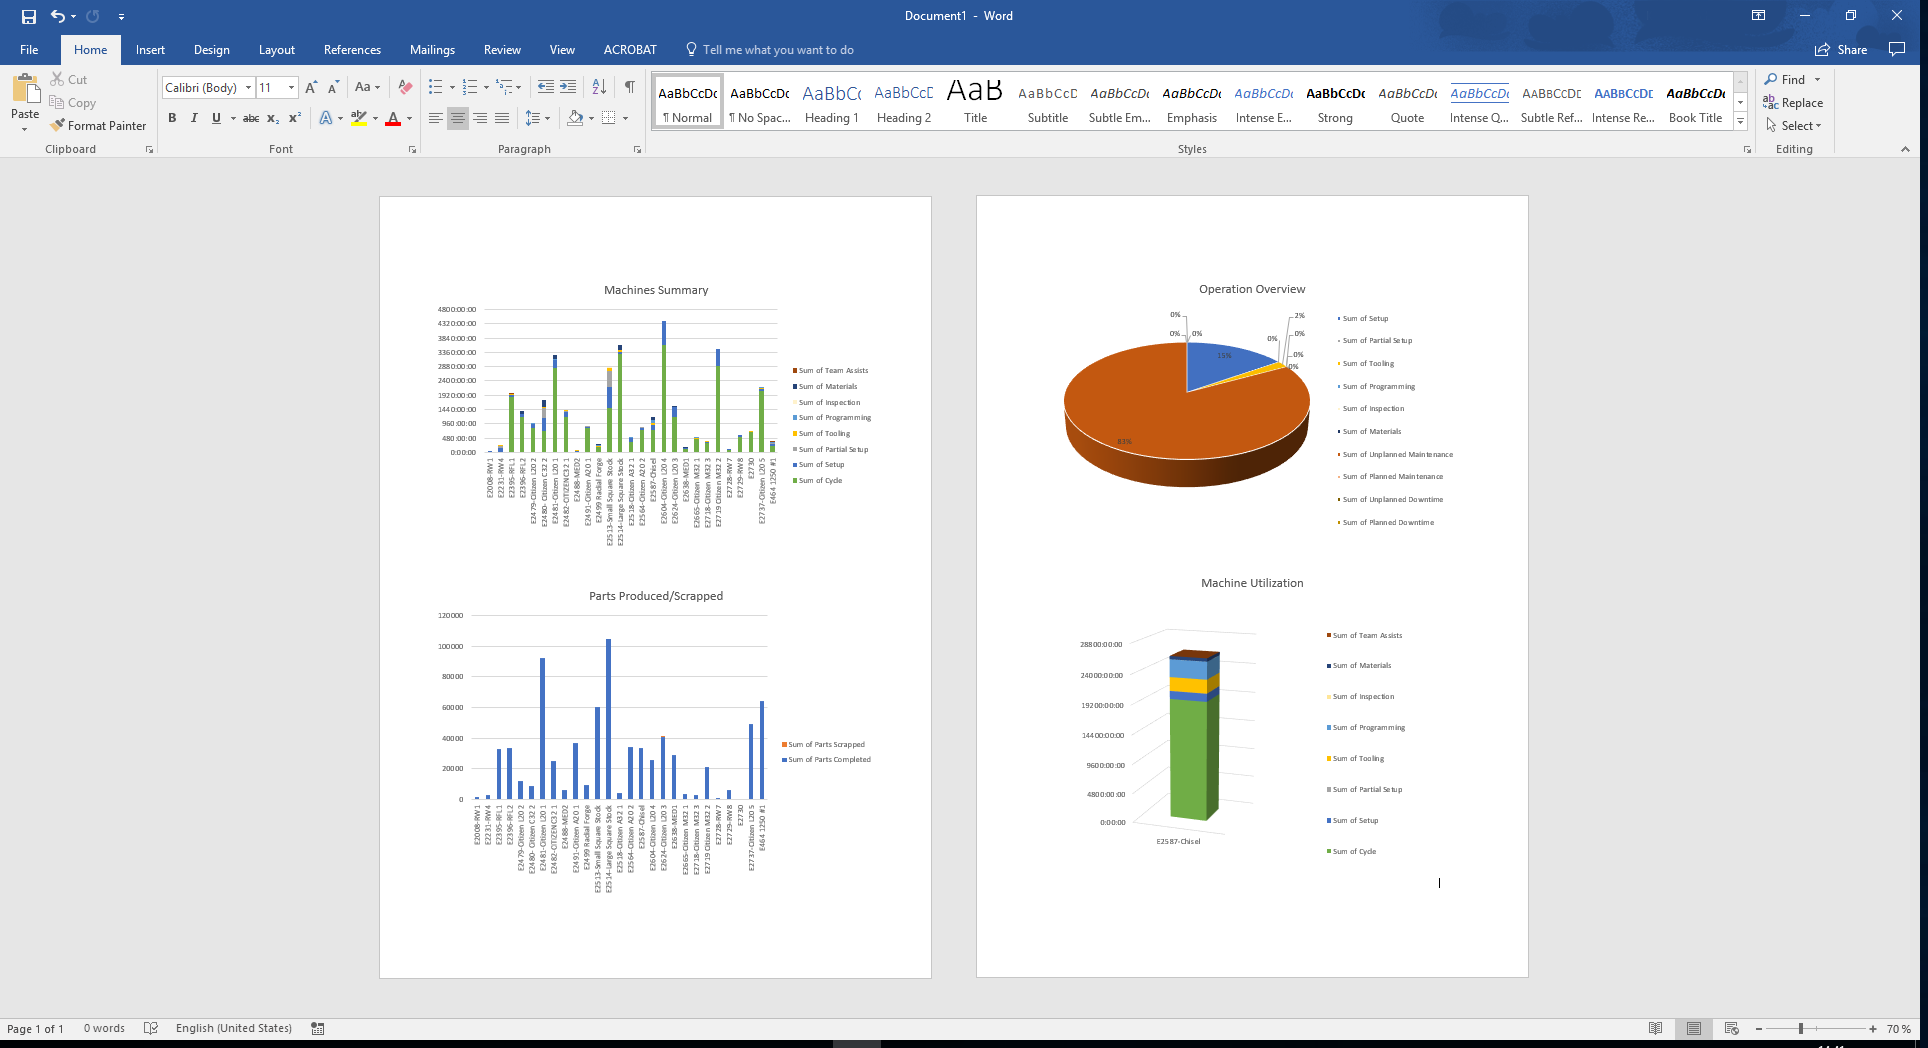
Export reports to Word or PDF
Integration
MDC-Max provides several ways to automate processes and exchange data with a company's existing software systems such as an MRP, ERP or MES.
Transfer data to external systems
On specific events or conditions, MDC-Max can transfer or update data in external data sources such as a database or web service. Data can also be exported and transfered in several formats such as XML and JSON.
External access to database
MDC-Max can authorise external systems to pull data directly from its database (read/write/update). Can normally be configured using the standard Open Database Connectivity API (ODBC).
Further integration and automation
MDC-Max also provides the OEMLink C++ library which can be programmed to "catch" incomming data events and trigger custom code to call a web service, export data, call up external APIs, and more
Network options
MDC-Max can be installed on your existing network and supports a variety of protocols and hardware options including serial wiring, Ethernet and wireless networking.
Connections
MDC-Max uses a network to establish connections and collect data from equipment. Often a company's exiting local network is used, but in some cases a dedicated, closed network is preferred. Depending on the machines' data collection capabilities, different approaches are possible.
Direct connection
If a data interface is available on the machine (see table below), it can often be connected to a network via an Ethernet cable. No additional hardware is required beyond optional devices for operator input such as a mounted tablet. However, if the interface is disabled on the machine control, it can be costly to activate. In this case, a Hardware connection might be preferred.
Hardware connection
If no interface is available, a technician can "pull" signals from the machine using a combination of internal wiring to PLC relays and devices such as an MDC-Box or the Moxa ioLogik. These devices manage the connection between the machine and network, and facilitate signal transmission to MDC-Max.
Supported controls
For direct connections, MDC-Max supports a wide variety of machine controls. The following are some of the most common, but many more are supported. If your control is not listed, please contact us for more information. We are continuously adding support for new machines.
| Control | Required interface | Extent of data access |
|---|---|---|
| Fanuc | FOCAS | Full compatibility |
| Haas | M-Net | Full compatibility |
| Mazak | MTConnect | Full compatibility |
| Okuma | MTConnect | Full compatibility |
| Mitsubishi | MTConnect | Full compatibility |
| NUM | MTConnect | Full compatibility |
| Heidenhain | DNC Opt #18 | Full compatibility |
| Siemens (840D, 810D) | Hardware adapter | Most compatibility |
ALL FEATURES
System components
Scalable architecture / multiple plant support
MDC-Max is a versatile solution that can suit both small shops and large enterprises with thousands of machines across multiple locations. It consists of Server, PC client and Web Client components that can run on one PC or multiple servers with unlimited PCs and Web Clients connected.
CIMCO MDC-Max Server
Server application that runs a fast SQL database (optionally Microsoft SQL) and handles various tasks in the background, such as processing incoming data, updating reports, communicating with external systems and distributing monitoring data to Dashboards, Live Screens, Operator Screens, etc.
CIMCO MDC-Max PC Client
Windows-based PC client application that allows configuring the MDC-Max system. The PC client also shows Timelines, Live Screens, Operator Screens and offers advanced reporting features.
CIMCO MDC-Max Web Client (mobile client / mobile monitoring)
Web client that works on any modern mobile device, such as tablet, smartphone or smart TV. Allows remote access to Operator Screens, Dashboards, Live Screens and Shop Floor Screens. Data is updated in real-time without browser-reloading and all clients can be updated centrally. Supports bright and dark themes.
CIMCO DNC-Max (machine communication)
Software for configuring machine ports and managing network. Also offers features such as advanced program transfers, Remote Request, dynamic feedrate and spindle speed adjustment, auto-receive, parameter offsets and more.
Data collection
CIMCO MDC-Max tracks both scheduled and unscheduled downtime by combining machine and operator data. While machine data can be collected accurately, error-free and unattended, operator data provides the context to fully understand reasons for downtime, scrap or other aspects that impact production negatively.
Automatic data collection
Accurate data from machines is collected automatically and unattended by MDC-Max. Most installations will, as a minimum, collect data on Cycle Start, Cycle Stop, and Part Complete. The data collection events can be customised according to the monitoring capabilities of each machine.
Manual data collection
MDC-Max offers an easy-to-use operator interface for mobile and PC to view and enter data manually. Operators can register the exact causes of machine downtime such as Setup, Maintenance, Scrap, Inspection and more. MDC-Max also supports barcode readers.
Unlimited data collection events
MDC-Max can be configured to collect data on any event limited only by machine capabilities.
Real-time monitoring / Andon boards / digital signage
Machine Timelines
Real-time monitoring using Timeline charts enables you to easily monitor the current and past state of all your machines. Each machine state and downtime reason is visualised with different bar colors and can be expanded to reveal additional information.
Real-time reporting
Set up real-time reports in the MDC-Max PC client that are dynamically updated, on screen, as incomming data is processed. You can have multiple reports open and updating in different tabs at the same time. The MDC-Max reporting system is flexible and can support any custom reports that suit your operation's needs.
Dashboards
Dashboards provide an overview of your real-time production data and KPIs (such as OEE) at a glance. Create multiple custom Dashboards to focus on different production facilities, different machine groups or other requirements you may have. Dashboards can be displayed on large TV monitors as digital signage or on any mobile device using the MDC-Max Web Client.
Live Screens
Live Screens show the state of each machine in real-time, along with OEE, current job, operator/shift, parts produced/scrapped and cycle time. Machines are color-coded by state, with flashing colors and alert lights for critical states. You can customise Live Screens and display them on large TV monitors or any mobile device with the MDC-Max Web Client.
Shop Floor Screens
Shop Floor Screens let you see the status of all your machines based on their location. Machines are color-coded by state, with notification/alert lights for critical states. Tap any machine to see KPIs (OEE), current operator/job and more. You can display Shop Floor Screens on large TV monitors or any tablet or smartphone with the MDC-Max Web Client. You can also move, scale, rotate and change the look of machines.
Slideshows
Make Slideshows of your Dashboards, Live Screens and Shop Floor Screens. Slideshows scroll through the whole content of each screen and can be paused and resumed as needed. You can show Slideshows on large TV monitors or any mobile device with the MDC-Max Web Client.
Andon units and notifications
Control of signaling units
MDC-Max enables you to control various signaling units that provide visual and audible feedback of machine state. These include Tower Stack lights, Beacons, sound alarms and more. You can customise how machine and operator events activate different colors or sounds on the signaling units. You can also assign a single signaling unit, such as a stack light, to a group of machines.
Email and text notifications on any event
MDC-Max can alert key staff via text and email for any event from machines or operators. If a machine falls behind or stops while running unattended, such as in Lights-out Manufacturing, MDC-Max can promptly notify the right person to take action.
Downtime tracking, operator feedback
Dedicated Operator interface (PC and mobile)
MDC-Max offers a user-friendly operator interface (Operator Screen) that lets operators view vital information and enter data such as downtime reasons, current job/operator/shift, scrap reasons and more. You can customise the operator interface to suit your needs and use it on any touch-enabled mobile device or PC on the shop floor. You can also mount a tablet at every machine or manage multiple machine-specific operator interfaces from a single mobile device with ease.
Barcode reader support
MDC-Max works with barcode readers and gives you instructions for setting up and printing new barcodes. You can use barcodes to send data to MDC-Max such as current job, operator, shift, scrapped parts or downtime reasons. Barcode readers are mostly relevant if you already have them. Otherwise, we suggest using Operator Screens which have more features and flexibility.
Unlimited number of Downtime Reasons
MDC-Max supports and unlimited number of downtime reasons to meet the requirements of any operation. Downtime reasons can be sent using the Operator Screen or using a Barcode Reader.
Supports Job and Program numbers
MDC-Max has dedicated options for managing Job and Program numbers and can automatically link the event data it collects, from machines and operators, to the job running on each machine. This allows MDC-Max to provide precise statistics about every job on every machine.
Reporting
Real-time and historic reports
MDC-Max can create both real-time and historic reports. Real-time reports are updated on screen as new data comes in, while historic reports use existing data to summarise longer time periods such as a week, month or year. With its modern tabbed interface, the MDC-Max PC Client lets you have multiple reports open and updating at the same time.
Predefined report templates
MDC-Max comes with many predefined reports that meet most common reporting needs and that can be used as templates for further customisation.
Unlimited custom reports (report examples)
With the flexible reporting system in MDC-Max, you can create custom reports to suit any operation. Display data in tables, pie or bar charts, include production targets, work shifts and calculate any KPI, using user-defined formulas, such as OEE, MTBF, MTTR, and more.
Examples of reports:
- Overall Equipment Effectiveness (OEE)
- Cycle time per part (min, max and average)
- Number of parts per shift/operator
- Number of defective/scrapped parts
- Machine downtime
- Scheduled maintenance
- Unscheduled maintenance
- Setup time per part
- Machine Operator Efficiency
- Mean time between failures (MTBF)
- Mean time to repair (MTTR)
Event log reporting (user, machine, job, activity)
Generate detailed activity reports such as Error logs, Operator logs and Machine logs.
Export and auto-update reports in Excel
CIMCO MDC-Max comes with full support for Microsoft Excel spreadsheets. You can easily export reports for further analysis in Excel and MDC-Max can even update your Excel spreadsheet automatically, so you always have the latest data.
Stand-alone Excel reports (with direct data access)
With our advanced Excel reports, data from MDC-Max can be pulled directly into Excel. This enables anyone in your organisation, with the right permissions, to generate reports directly in Excel.
Send reports via email
Reports can be automatically exported to Excel, XML, or other formats and emailed.
Security and user management
Secure user management
The secure and robust user/group management system in MDC-Max enables fine-grained control over user access and permissions. The MDC-Max clients, database configuration and Operator Screen cannot be accessed without appropriate permissions.
Complete logging
MDC-Max keeps detailed logs of all incoming and outgoing events including Error logs, Operator logs and Machine logs. You can store logs permanently or restart them on a daily, weekly or monthly basis. You can also export logs to an external database (that other systems can access) or directly to an Excel spreadsheet.
Network and machine connections
Supports Wireless, Ethernet, RS-232 and Parallel I/O
MDC-Max can connect with your existing network and works with various hardware options such as serial wiring, Ethernet and wireless networking. MDC-Max gathers data from equipment on your network either directly (if a data collection interface is available) or indirectly using additional hardware to establish the connection. The data collection method depends on the specific type of equipment and its monitoring capabilities.
Extensive support for data collection protocols
MDC-Max comes with specialised messaging protocols for communicating directly with a wide variety of network based machines/interfaces including Fanuc FOCAS, Haas M-Net, MTConnect, Heidenhain, Netlink, Brother, OPC, Modbus, MQTT, and more.
Support for Telemetry data
MDC-Max includes powerful functions for date collection and management based on analog signals. Calculations such as spindle speed, power consumption, etc. can be used in Andon boards, reports, exports, and much more.
Support for extracting DPRNT messages
MDC-Max can be configured to extract messages from incoming DPRNT commands, sent from a machine's serial communications port.
Integration with external systems
Integration with external data sources
MDC-Max can automatically read/write/update data in multiple data sources such as external databases, Web Services and XML file export. You can associate data exchange with specific events and user-defined conditions. This enables integration with external systems such as your ERP and MES systems.
Direct ODBC connection to database
If required, external systems can access (read/write/update) data in the MDC-Max database directly using the ODBC protocol.
Integration with external systems through OEM Link
For custom integration with external systems and automation of processes, CIMCO provides a C++ library called OEM Link (.dll) which can be customised by the customer. The OEM Link is controlled by the MDC-Max Server and can be programmed to "catch" events from operators and machines as they are received by MDC-Max. This enables the customer to run custom code whenever specific events occur such as calling a Web Service, exporting data to a specific file format or communicate with external APIs.